India has revised its GDP base year to 2022–23 and introduced advanced Supply and Use Tables, eliminating statistical discrepancy in national accounts.
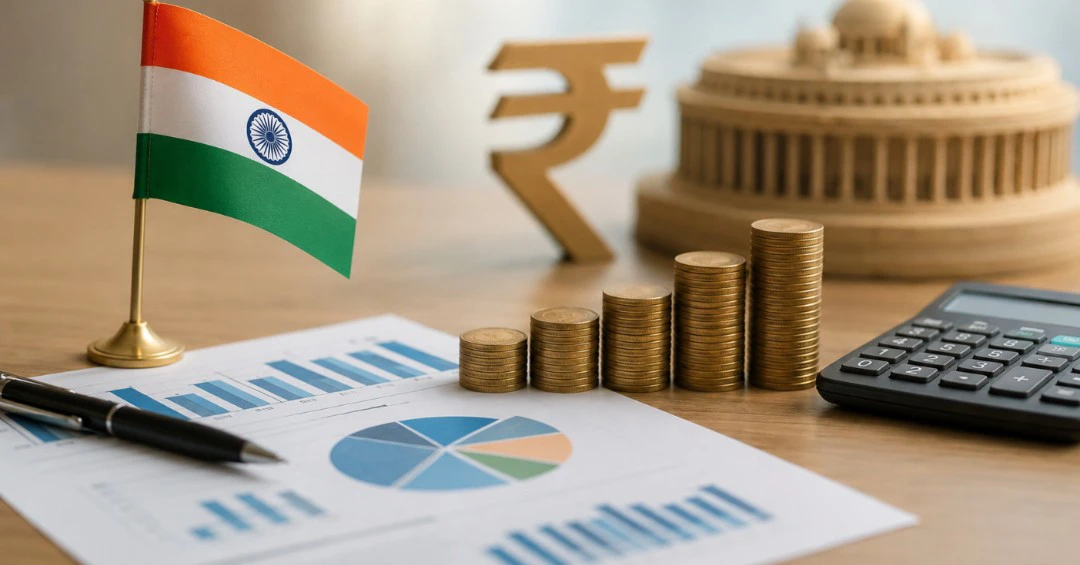
NEW DELHI, May 16: India has undertaken one of the most significant overhauls of its national accounting system in recent decades, with the Ministry of Statistics and Programme Implementation (MoSPI) introducing a revised GDP series based on the new base year of 2022–23 and a fully integrated Supply and Use Table (SUT) framework for 2022–23 and 2023–24.
The revised framework, released by the National Accounts Division on February 27, 2026, restructures how India measures economic activity and aligns the country’s macroeconomic accounting with evolving international standards under the System of National Accounts 2025 (SNA 2025).
At the centre of the revision is a major methodological shift that eliminates the long-standing “statistical discrepancy” between GDP estimates generated through production and expenditure approaches. Officials said the new balancing framework now reconciles all economic flows through detailed product-level accounting, ensuring internal consistency across the national accounts.
New Base Year Reflects Post-Pandemic Economy
The base year for GDP calculations has been updated from 2011–12 to 2022–23. According to the Ministry, the change was recommended by the Advisory Committee on National Accounts Statistics (ACNAS) after assessing the structural transformation of the Indian economy over the past decade.
Officials stated that 2022–23 was selected because it represented a relatively stable economic period after the disruptions caused by the COVID-19 pandemic and also offered wider availability of reliable data across sectors.
The revised series is intended to better capture the current structure of India’s economy, including technological expansion, changes in consumption behaviour, new service-sector activities, and evolving industrial patterns.
GDP Crosses Rs. 289 Lakh Crore in 2023–24
Under the revised framework, India’s GDP at current prices for 2022–23 was estimated at Rs. 2,61,17,627 crore.
The total output of the economy at basic prices stood at Rs. 5,34,01,984 crore during the base year, while intermediate consumption was estimated at Rs. 2,96,38,222 crore. This resulted in a Gross Value Added (GVA) of Rs. 2,37,63,761 crore. Product taxes net of subsidies accounted for Rs. 23,53,866 crore.
For 2023–24, GDP expanded to Rs. 2,89,83,909 crore, reflecting continued economic growth. Total output rose to Rs. 5,73,73,979 crore, while GVA increased to Rs. 2,63,16,103 crore.
Household consumption expenditure also recorded growth during the period. Private Final Consumption Expenditure (PFCE), often considered a key indicator of domestic demand, increased from Rs. 1,49,22,831 crore in 2022–23 to Rs. 1,63,76,828 crore in 2023–24.
Gross Fixed Capital Formation (GFCF), which reflects investment activity in the economy, rose from Rs. 84,53,504 crore to Rs. 92,45,752 crore.
End of the “Statistical Discrepancy”
One of the most notable changes in the revised GDP framework is the elimination of statistical discrepancy.
Traditionally, GDP estimates compiled through production, income, and expenditure approaches often differed because of varying data sources, reporting delays, estimation methods, and coverage limitations. India previously treated the production-side estimate as the official GDP figure and published the difference separately as a “discrepancy.”
The new SUT-based framework removes that gap by adopting a balancing system in which total supply and total use must mathematically match for every product category.
Under this framework, total output and imports are reconciled against intermediate consumption, household consumption, government expenditure, investments, and exports. Detailed adjustments are also made for trade margins, transport costs, and taxes.
Officials said the balancing process now operates at a highly granular product level through iterative reconciliation methods, allowing inconsistencies to be corrected systematically rather than absorbed into residual categories.
Major Methodological Upgrades Introduced
The revised series also introduces extensive methodological improvements and expanded use of administrative and survey-based datasets.
A significant improvement has been made in the estimation of household consumption expenditure. Earlier GDP series relied heavily on commodity-flow methods for several consumption categories. The new framework incorporates benchmark data from the Household Consumption Expenditure Survey (HCES) for nearly half of the 128 PFCE items.
For sectors still dependent on commodity-flow estimates, the Ministry has strengthened calculations using data from agencies such as the Central Electricity Authority (CEA), Directorate General of Civil Aviation (DGCA), and updated transport studies.
Tax allocation methods have also been refined. Instead of broad proportional distribution, taxes such as GST, excise duty, and import duties are now mapped directly to individual product categories using detailed administrative records and tax schedules.
Trade and Transport Margins (TTM), which bridge producer prices and purchaser prices, are now estimated using multiple data sources including the Annual Survey of Industries (ASI), HCES data, and state-level price indices.
The corporate sector estimates have also become more granular through the use of MGT-7 filings and Ministry of Corporate Affairs databases. Officials said the inclusion of Limited Liability Partnerships (LLPs) has improved the coverage of private corporate activity.
More Detailed Economic Classification
The revised Supply and Use Table framework significantly expands the classification structure of the economy.
The old series contained 140 product categories and 66 industries. The new framework expands this to 155 products and 67 industries, aligned with updated classification systems such as NIC 2025 and COICOP 2018.
The agriculture sector now tracks several products separately that were previously grouped together. Categories such as citrus fruits, cabbage, cauliflower, poultry meat, mutton, and beef now receive independent statistical treatment.
Mining activities have also been disaggregated into detailed fuel and metallic mineral categories including coal, lignite, crude petroleum, and natural gas.
Manufacturing continues to be compiled across 30 categories linked closely with the Annual Survey of Industries, while the services sector has been divided into 27 industries producing 29 specific service products.
Shift Toward Higher Transparency
Officials said the revised balancing strategy reflects a broader effort to improve the credibility and transparency of India’s economic statistics.
In earlier series, unresolved balancing gaps were often absorbed into private consumption or inventory estimates. Under the new framework, the balancing process instead adjusts intermediate consumption, trade margins, and taxes through detailed reconciliation exercises in order to preserve the integrity of benchmark consumption estimates.
The revised GDP series and integrated Supply and Use Tables represent a major institutional shift in India’s macroeconomic accounting architecture. By aligning with international standards and strengthening the statistical foundation of national accounts, the government aims to provide a more accurate representation of economic activity in one of the world’s largest economies.